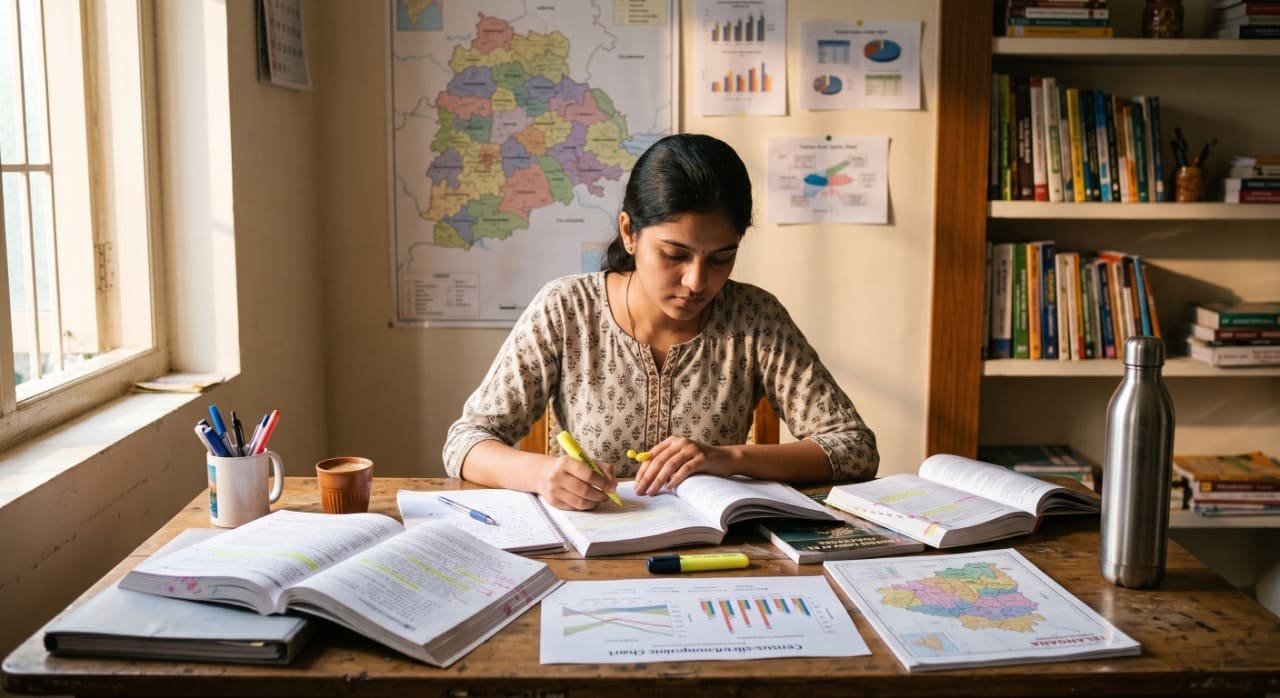
Why Telangana’s Demographic Profile Matters for TSPSC Exams
When TSPSC aspirants hear the word demography, many immediately think of boring numbers: population, literacy rate, sex ratio, density, rural population, urban population, SC population, ST population, and child population. But if you study demography only as data, you will forget it quickly. If you study it as a story of Telangana’s society, economy, and governance, it becomes one of the most useful topics in your preparation.
Demography tells us who lives in Telangana, where they live, how educated they are, how balanced the gender ratio is, how many people live in villages and towns, how many belong to Scheduled Castes and Scheduled Tribes, and how many children are in the 0–6 age group. These facts are not just for Prelims. They are also powerful for Mains answers on welfare, education, health, urbanization, rural development, women empowerment, social justice, and planning.
Before we begin, one important clarification is necessary. The latest completed official Census for India is Census 2011. Census 2021 was postponed, and Census 2027 has been announced as India’s first digital Census. Therefore, for Telangana’s official Census-based demographic profile, aspirants should use 2011 Census data as the latest completed Census data, while also being aware of the upcoming digital Census 2027. The Telangana State Portal lists Telangana’s population as 3,50,03,674 as per Census 2011. (Source: Government of Telangana State Profile, [https://www.telangana.gov.in/About/State-Profile/](https://www.telangana.gov.in/About/State-Profile/))
Telangana at a Glance: Must-Know Demographic Facts
Telangana became the 29th state of India on 2 June 2014. Since the state was formed after Census 2011, the demographic data is calculated for the Telangana region as per the 2011 Census. This is important for TSPSC because questions may ask about population figures, density, sex ratio, literacy, rural-urban distribution, and social composition.
Important Census-based facts for Telangana
- Total population: 350.04 lakhs, or 3,50,03,674.
- Male population: 176.12 lakhs.
- Female population: 173.92 lakhs.
- Sex ratio: 988 females per 1000 males.
- Population density: 312 persons per sq. km.
- Decadal growth rate: 13.58% during 2001–2011.
- Rural population: 213.95 lakhs.
- Urban population: 136.09 lakhs.
- Rural population share: 61.12%.
- Urban population share: 38.88%.
- Literacy rate: 66.54%.
- Male literacy rate: 75.04%.
- Female literacy rate: 57.99%.
- Child population, 0–6 years: 38.99 lakhs.
- Child sex ratio: 932 girls per 1000 boys.
- SC population: 54.09 lakhs.
- ST population: 31.78 lakhs.
These figures should be revised repeatedly because they are useful for direct Prelims questions. But do not stop there. For Mains, each number should become an argument. For example, 61.12% rural population tells you why rural development, agriculture, irrigation, Panchayati Raj, and welfare delivery are so important in Telangana. A literacy rate of 66.54% tells you why education and skill development remain critical policy areas.
Total Population: What the Number Tells Us
According to Census 2011, Telangana’s total population is 3,50,03,674. This places Telangana among India’s important medium-to-large states in terms of population size. For an aspirant, population is not just a number. It is the base for planning schools, hospitals, roads, drinking water, ration distribution, employment programmes, welfare schemes, local body representation, and public administration.
Whenever you write an answer on governance, remember that every policy decision has a demographic base. A state cannot plan effectively unless it knows how many people live in rural areas, how many children need schools, how many women need health services, how many elderly persons need social security, and how many workers need livelihood opportunities.
Exam angle
- For Prelims, remember Telangana’s population figure as per Census 2011.
- For Mains, connect population with welfare planning, public service delivery, and resource allocation.
- For Interview, be ready to discuss how demographic data helps district administration.
Sex Ratio: A Key Indicator of Gender Balance
Telangana’s overall sex ratio as per Census 2011 is 988 females per 1000 males. This is an important indicator because sex ratio reflects gender balance in the population. A better sex ratio generally indicates relatively better demographic balance, but it should be studied along with other indicators such as female literacy, women’s health, workforce participation, safety, and access to opportunities.
Telangana’s rural sex ratio is 999, while the urban sex ratio is 970. This rural-urban difference is important. It shows that demographic patterns are not uniform across the state. Urban areas may have more male migration for work, which can affect the sex ratio. Rural areas may show different social and migration patterns.
However, aspirants should be careful. A good overall sex ratio does not automatically mean gender equality is complete. Female literacy, health outcomes, employment, political participation, property rights, safety, and social attitudes must also be considered.
How to use in Mains
You can write that Telangana’s sex ratio reflects an important demographic strength, but the lower child sex ratio of 932 and lower female literacy compared to male literacy show the need for continued focus on girl child welfare, education, nutrition, healthcare, and social awareness.
Child Sex Ratio: Why It Needs Special Attention
The child sex ratio refers to the number of girls per 1000 boys in the 0–6 age group. Telangana’s child sex ratio as per Census 2011 is 932. This is lower than the overall sex ratio of 988. For TSPSC, this difference is very important.
Why? Because child sex ratio reflects the condition of girl children in society. A lower child sex ratio may indicate issues related to gender preference, social attitudes, healthcare access, nutrition, and survival of girl children. It is a sensitive indicator of gender justice.
If you get a Mains question on women empowerment or child welfare, you can use this point effectively. Write that improving women’s status requires intervention from childhood itself. Policies must focus on nutrition, immunization, school enrollment, prevention of child marriage, safety, and equal opportunities for girls.
Important points for answer writing
- Overall sex ratio and child sex ratio should be compared.
- Lower child sex ratio indicates the need for girl child-focused policies.
- Education, health, nutrition, and social awareness are essential.
- Local bodies, schools, Anganwadi centres, and health workers play a major role.
Literacy Rate: The Foundation of Human Development
Telangana’s literacy rate as per Census 2011 is 66.54%. Male literacy is 75.04%, while female literacy is 57.99%. This gender gap in literacy is one of the most important points for TSPSC aspirants.
Literacy affects almost every area of development. A literate population is better able to access government schemes, participate in democratic processes, improve health awareness, adopt technology, find employment, and support children’s education. Female literacy is especially powerful because it has a direct impact on family health, child nutrition, school enrollment, fertility choices, and social empowerment.
For Mains, do not merely write the literacy rate. Analyze it. Telangana has strong urban centres like Hyderabad, but literacy improvement across rural areas, tribal regions, and socially disadvantaged sections remains important. The gap between male and female literacy shows that educational development must be inclusive.
How to remember literacy data
- Total literacy: 66.54%.
- Male literacy: 75.04%.
- Female literacy: 57.99%.
- Main issue: Gender gap in education.
- Mains keyword: Human development.
Rural-Urban Distribution: Telangana’s Development Challenge
Telangana’s demographic profile shows that 61.12% of the population lives in rural areas, while 38.88% lives in urban areas. This is a crucial point. Telangana has a strong urban economy led by Hyderabad, but a majority of people still live in rural areas.
This rural-urban balance explains many policy priorities of the state. Rural Telangana requires focus on agriculture, irrigation, rural roads, drinking water, sanitation, Panchayati Raj, primary healthcare, schools, skill development, and rural livelihoods. Urban Telangana requires focus on housing, traffic, public transport, pollution, drainage, waste management, employment, and municipal governance.
For TSPSC, rural-urban distribution is useful in multiple subjects. In Economy, it connects with agriculture and service sector growth. In Polity, it connects with Panchayati Raj and urban local bodies. In Geography, it connects with settlement patterns. In Society, it connects with migration, inequality, and development gaps.
Exam-ready analysis
- Telangana is not fully urban despite Hyderabad’s strong dominance.
- Rural development remains central because most people live in villages.
- Urbanization creates opportunities but also governance challenges.
- Balanced regional development is essential for inclusive growth.
Population Density: Understanding Spatial Distribution
Telangana’s population density is 312 persons per sq. km as per Census 2011. Density tells us how many people live in a given area. It helps in planning infrastructure, transport, housing, water supply, schools, hospitals, and administrative services.
Density is not uniform across Telangana. Urban areas, especially Hyderabad and surrounding regions, are far more densely populated than many rural and forested areas. This uneven distribution creates different governance needs. A dense urban area needs better public transport, drainage, housing, pollution control, and solid waste management. A sparsely populated tribal or rural area needs connectivity, health outreach, education access, and livelihood support.
In Mains, you can connect population density with regional planning. Good governance requires district-specific and region-specific policies, not one-size-fits-all solutions.
SC and ST Population: Social Justice Dimension
Telangana’s Scheduled Caste population is 54.09 lakhs, and Scheduled Tribe population is 31.78 lakhs as per Census-based state data. These figures are very important for questions on social justice, welfare schemes, reservation, tribal development, education, land issues, livelihoods, and inclusive growth.
Demography helps governments identify vulnerable communities and design targeted interventions. For example, SC welfare may focus on education, hostels, scholarships, skill development, entrepreneurship, housing, and social protection. ST welfare may require a strong focus on land rights, forest rights, nutrition, health access, education in remote areas, livelihood security, and cultural protection.
For Telangana, tribal communities are particularly important in certain districts and forest regions. Aspirants should connect ST demography with topics like tribal welfare, scheduled areas, forest-based livelihoods, displacement, health indicators, education, and local self-governance.
Mains value
- Use SC/ST population data in answers on inclusive development.
- Connect demographic data with targeted welfare.
- Mention education, health, livelihood, and social empowerment.
- For tribal areas, connect with forest rights, local governance, and cultural identity.
Child Population: Planning for the Future
Telangana’s child population in the 0–6 age group is 38.99 lakhs, which forms 11.14% of the total population. This data is important because children represent the future human capital of the state.
Child population data helps governments plan Anganwadi centres, immunization, nutrition programmes, pre-primary education, primary schools, child protection services, and maternal health interventions. If the state invests well in children today, it improves future literacy, health, productivity, and social outcomes.
For TSPSC Mains, use child population data in answers on education, health, nutrition, women and child welfare, and human development. A strong answer can mention that demographic planning must begin early in life through maternal health, nutrition, immunization, early childhood care, and quality schooling.
Workers and Livelihood Profile
According to the Telangana State Profile, the total number of workers is 163.42 lakhs, including 137.20 lakhs main workers and 26.22 lakhs marginal workers. This is important for Economy and Society topics.
Workforce data tells us about employment, livelihoods, economic participation, and the quality of work. Main workers are those who work for a major part of the year, while marginal workers work for a shorter duration. A high number of marginal workers may indicate seasonal employment, underemployment, agricultural dependence, informal work, or unstable livelihoods.
For Telangana, workforce analysis should be connected with agriculture, construction, services, MSMEs, migration, women’s work, rural employment, and skill development. Do not study workers only as a fact. Study it as a livelihood issue.
How to use in Mains
- Discuss employment quality, not just employment quantity.
- Connect marginal workers with seasonal and informal work.
- Mention skill development, rural livelihoods, MSMEs, and women’s workforce participation.
- Use worker data in answers on Telangana economy and inclusive growth.
Why Census Data Is Important for Governance
Census data is one of the most important foundations of public policy. It helps governments decide where to build schools, where to improve health facilities, how to distribute welfare benefits, how to plan roads and housing, how to identify vulnerable groups, and how to allocate resources.
For example, if a district has a high tribal population, the administration must focus on tribal welfare, health outreach, education access, and forest-based livelihoods. If an area has rapid urban growth, municipal services must be strengthened. If female literacy is low, targeted education programmes are needed. If child sex ratio is low, girl child protection and awareness measures must be prioritized.
This is why TSPSC aspirants should treat demography as a governance tool. A future officer must know how data translates into policy action.
Census 2027: What Aspirants Should Know
Although Telangana’s latest completed Census-based data is from 2011, aspirants should stay updated about Census 2027. The Government of India has stated that Census 2027 will be India’s first digital Census, with mobile-based data collection and self-enumeration options. PIB information notes that Phase I, the Houselisting and Housing Census, is scheduled between April and September 2026, while Population Enumeration will follow as part of the Census 2027 process. (Source: PIB, [https://www.pib.gov.in/PressReleasePage.aspx?PRID=2255461](https://www.pib.gov.in/PressReleasePage.aspx?PRID=2255461))
This is important for current affairs because digital Census connects with Digital India, data governance, public policy, privacy, welfare targeting, and evidence-based planning. Once the new population data is released, it will become extremely important for TSPSC exams. Until then, continue using Census 2011 as the official completed Census base.
Important Census 2027 points
- It is described as India’s first digital Census.
- It includes mobile-based data collection.
- Self-enumeration option is part of the process.
- It will provide updated demographic data after a long gap.
- It will be highly relevant for future policy planning and exams.
How to Study Telangana Demography for Prelims
For Prelims, you need factual clarity. Prepare a small table and revise it frequently. Do not create bulky notes. Demography questions are often direct, and confusion between similar numbers can cost marks.
Prelims revision table
- Population: 350.04 lakhs.
- Sex ratio: 988.
- Density: 312 persons per sq. km.
- Rural population: 61.12%.
- Urban population: 38.88%.
- Literacy rate: 66.54%.
- Male literacy: 75.04%.
- Female literacy: 57.99%.
- Child sex ratio: 932.
- SC population: 54.09 lakhs.
- ST population: 31.78 lakhs.
Revise this table once every week. Before the exam, revise it daily for a few days. These are easy marks if you remember accurately.
How to Use Demography in Mains Answers
In Mains, do not dump data randomly. Use data only where it strengthens your argument. One or two relevant numbers are enough. The examiner should feel that you understand Telangana’s society, not that you are copying a statistics table.
Examples of smart usage
- In an answer on rural development, mention that 61.12% of Telangana’s population is rural, making village-level infrastructure and Panchayati Raj essential.
- In an answer on women empowerment, mention the gap between male literacy of 75.04% and female literacy of 57.99%.
- In an answer on child welfare, mention the child sex ratio of 932 and the need for girl child-focused interventions.
- In an answer on urban governance, mention that 38.88% of Telangana’s population is urban, and urbanization requires stronger municipal planning.
- In an answer on social justice, use SC and ST population figures to support targeted welfare and inclusive development.
Common Mistakes Aspirants Make
Demography looks simple, but aspirants often lose marks due to small mistakes. Be careful with figures and interpretation.
Avoid these mistakes
- Do not say Census 2021 is the latest completed Census. It was postponed.
- Do not confuse Census 2011 data with later projections.
- Do not memorize only total population and ignore literacy, sex ratio, and rural-urban data.
- Do not write data without analysis in Mains answers.
- Do not assume a good overall sex ratio means all gender issues are solved.
- Do not ignore child sex ratio and female literacy.
- Do not study Telangana demography separately from economy, society, and governance.
Final Mentor Advice
Telangana’s demographic profile is a compact but powerful topic. It gives you facts for Prelims and arguments for Mains. The key is to study the numbers with meaning. Population tells you the scale of governance. Rural-urban distribution tells you development priorities. Sex ratio tells you gender balance. Child sex ratio tells you social concerns. Literacy tells you human development. SC and ST population tells you the need for social justice.
At CrackSarkar, we always advise aspirants to convert data into understanding. Do not fear numbers. Use them wisely. A single correct demographic figure in a Mains answer can make your answer look mature, Telangana-specific, and exam-ready.
Remember this clearly: until new Census results are officially released, Census 2011 remains the latest completed Census base for Telangana’s demographic profile. Keep an eye on Census 2027, but revise Census 2011 data thoroughly for present TSPSC preparation.
Study Telangana demography like a future officer. Ask what each number means for schools, hospitals, roads, welfare, employment, women, children, farmers, tribal communities, and urban citizens. That is how this topic moves from memory to marks.